
Introduction
Last month Labour signed a landmark co-operation agreement with Plaid Cymru.
The agreement sets forward a radical programme to be delivered by Welsh Labour in cooperation with Plaid members in the Senedd.
The agreement covers key areas such as energy and climate, and housing as well as a commitment to Senedd Electoral Reform. These proposals include expanding the chamber to between 80 and 100 members, elected under a voting system which is as proportional – or more – than the current one alongside putting gender quotas into law for the first time.
Now, as part of the process of agreeing and delivering on these vital reforms of the Senedd the Welsh Labour Executive are consulting with party members and affiliates on what those reforms should look like and which electoral system will serve Wales and Labour best. In that consultation they have outlined three options of voting system to support a larger Senedd; a modified Additional Member System (AMS), the Flexible List or the Single Transferable Vote (STV).
To outline what a larger Senedd elected via STV might look like, we have undertaken some modelling of results using a combination of YouGov polling and the regional list vote in the Senedd elections in May 2021.
Methodology
It is important to note that it is impossible to predict with complete certainty the outcome of a particular election, if it had been held using a different voting system. The projections that follow are an indication of what the results of the 2021 Senedd election – conducted under the Additional Member System (AMS) – may have looked like if the Single Transferable Vote (STV) system had been used. It is of course impossible to account for other changes that would likely accompany a switch to an alternative electoral system, such as changes in voter behaviour, party campaigning, or the number of parties standing candidates.
For our STV projections, it was necessary to create new multi-member constituencies. We paired each of the current 40 First-Past-The-Post (FPTP) Senedd constituencies into 20 multi-member STV constituencies, each with between three to six members, depending on the electorate of the STV constituency and the overall number of seats in the Senedd – we produced projections for a Senedd of 80, 90 and 100 members. We created the 20 STV constituencies by pairing the current 40 FPTP constituencies for two reasons. Firstly, it mirrors the approach taken in the Expert Panel report on Assembly Reform and secondly because this was the most straightforward way of using the existing Senedd election results. We have no firm views on the optimum specific constituency boundaries for a STV-elected Senedd.
We obtained the regional list vote count for each of the 40 FPTP Senedd constituencies, from the respective Regional Returning Officers. We regard the regional list vote as a better measure, for our purposes, than the FPTP constituency vote, as the regional list vote represents the proportional part of the current AMS system. Parties’ votes were then added up and their vote shares calculated for each STV constituency.
Although the regional list represents the proportional part of the AMS system, it may be that some people still applied tactical considerations when voting on their regional list ballot paper. For example, a voter in any of the three South Wales regions, may have realised that it was highly unlikely that Labour would be in a position to pick up any of the ‘regional list’ MSs and therefore decided to give their regional list vote to a different party, even if their first preference was for Labour. In an attempt to somewhat mitigate this and try to get a sense of voters’ genuine first preferences we commissioned a post Senedd election YouGov poll, asking which party would have been their first preference choice at the election. The fieldwork for this poll was conducted between the 7th and the 11th May 2021, with a sample size of 1039 adults in Wales (16+).1The question asked by YouGov was as follows: “Please indicate how you would have voted in the Senedd (Welsh Parliament) election if you had been asked to rank the parties in your order of preference. Put 1 for your preferred party, then 2 for your second best party, then 3 for your third* choice etc. You may rank as many or as few choices as you wish. If you would not vote or do not know how you would vote, tick the boxes below.” *First and second preferences sufficed for our modelling.
We then used the first preference data from the YouGov poll to adjust the results in each STV constituency, in an attempt to get a slightly more accurate picture of voters’ genuine first preference. We compared how people said they had actually voted in the regional list section of the Senedd election, with the party they listed as their first preference in the YouGov poll and then adjusted accordingly. For the three biggest parties (Labour, Conservatives and Plaid) these adjusted results were calculated on a regional basis, reflecting the polling data in each of the five electoral regions. For the other parties, polling data from across the whole of Wales was used to adjust their results, as there were not enough voters in the poll to meaningfully apply the adjustment on a regional basis.
In order to help with the next part of the process, the allocation of seats to the STV constituencies, we also asked respondents to the YouGov poll who their second preference party at the Senedd election would have been. We then proceeded to allocate seats using the droop quota, which means that, to win a seat, a candidate must receive a vote equivalent to the total number of votes cast divided by the number of seats to be allocated plus one. For example, in a three-seat constituency, the droop quota is equivalent to 25%. Any party which reached the quota was allocated a seat. Seats were awarded on the basis of how many quotas of support (e.g. combinations of 25%) a party won. So, a party winning 50% of the vote in a three-member constituency was allocated two seats.
If no party achieved the quota, the party with the lowest vote share was eliminated and its vote share was redistributed to other parties using a formula based on second preference results from the YouGov poll. This process continued until all seats were allocated. In some cases when awarding the final seat, no party reached a full quota so the party with the highest remaining vote share was awarded the seat.
This modelling is of course only an approximation of the allocation of seats and transfers under STV and relies on a limited number of preferences (in a real-world STV election it is likely that a voter would rank more than two candidates/parties). But it does give an indication of how votes would transfer under STV and offers an insight into how voters’ choices would be translated into seats.
Results
Using the above methodology we have modelled the results of an 80, 90 and 100 seat Senedd elected under STV. The full results with constituencies and workings are available, thanks to the Electoral Reform Society for their assistance.
80 member Senedd
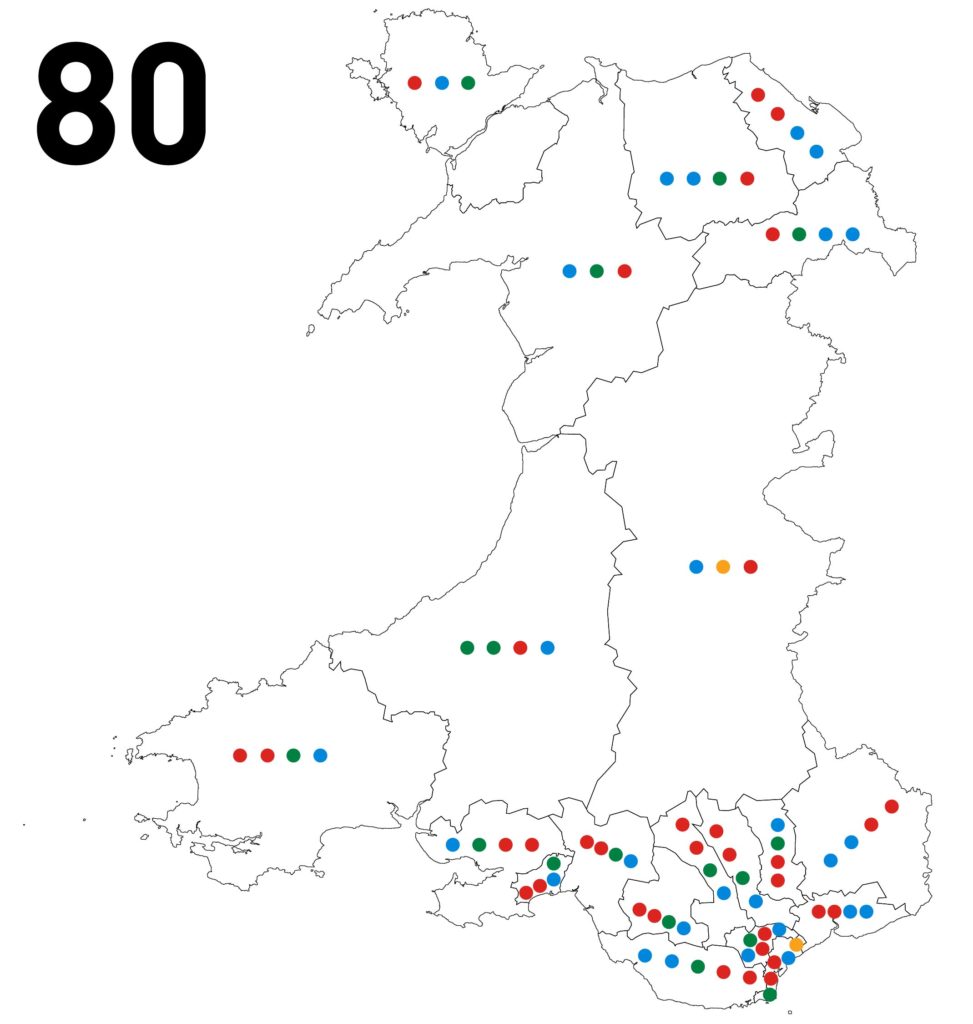
| Party | Con | Lab | LD | Plaid Cymru | Total Seats |
| Total seats under STV modelling | 27 | 34 | 2 | 17 | 80 |
| Proportion of seats under STV modelling | 33.75% | 42.50% | 2.50% | 21.25% | 100.00% |
90 member Senedd
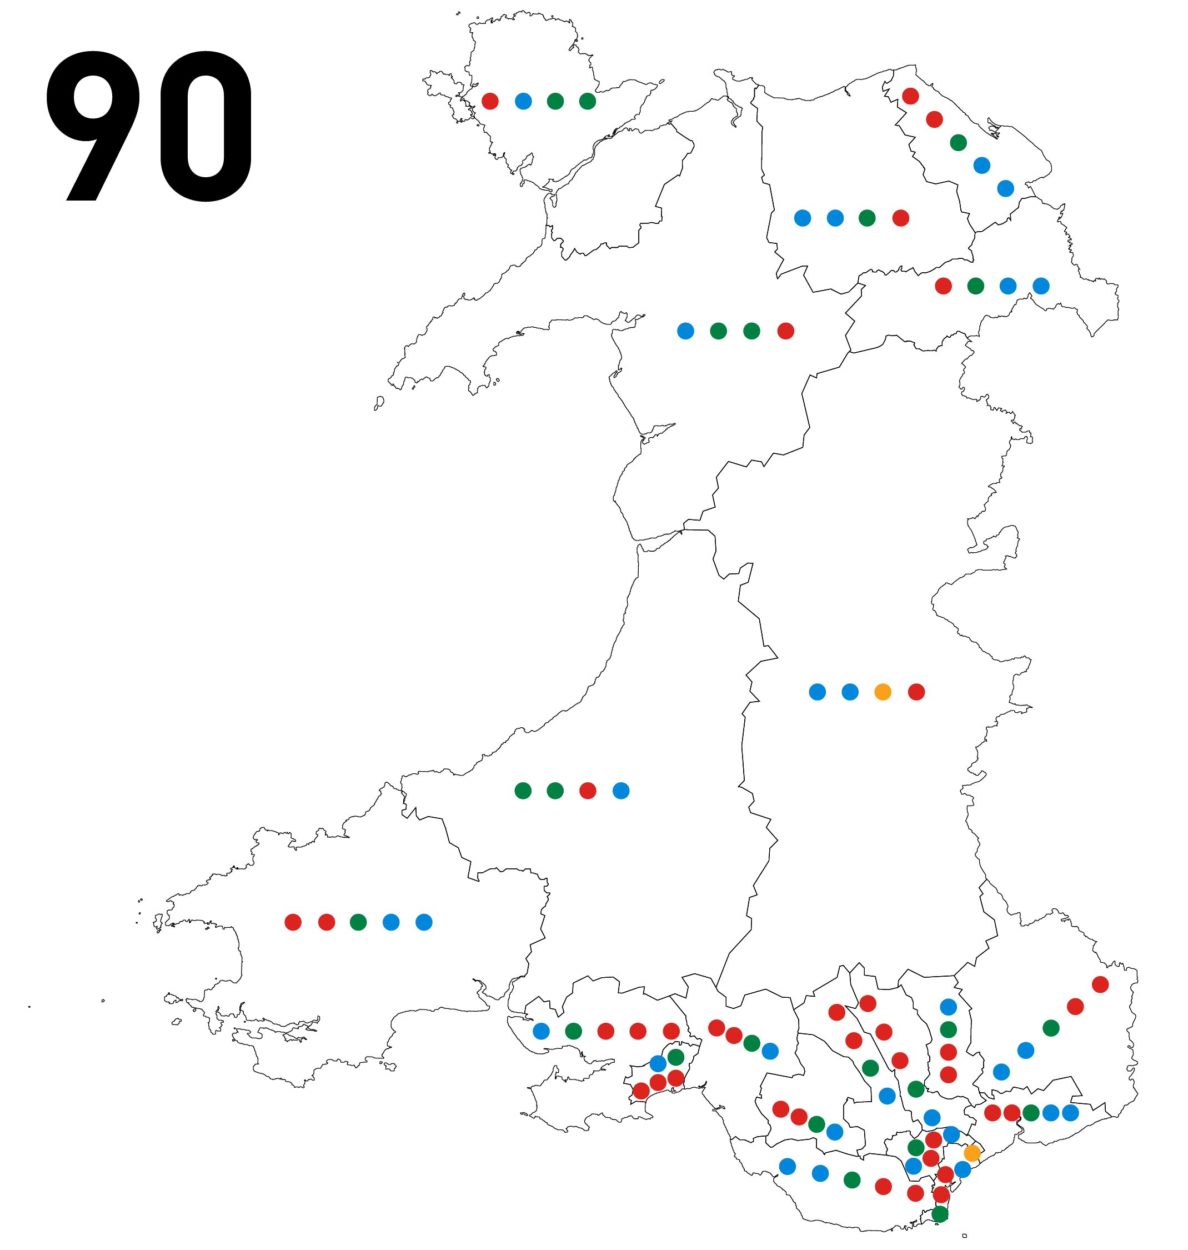
| Party | Con | Lab | LD | Plaid Cymru | Total Seats |
| Total seats under STV modelling | 29 | 37 | 2 | 22 | 90 |
| Proportion of seats under STV modelling | 32.22% | 41.11% | 2.22% | 24.44% | 100.00% |
100 member Senedd
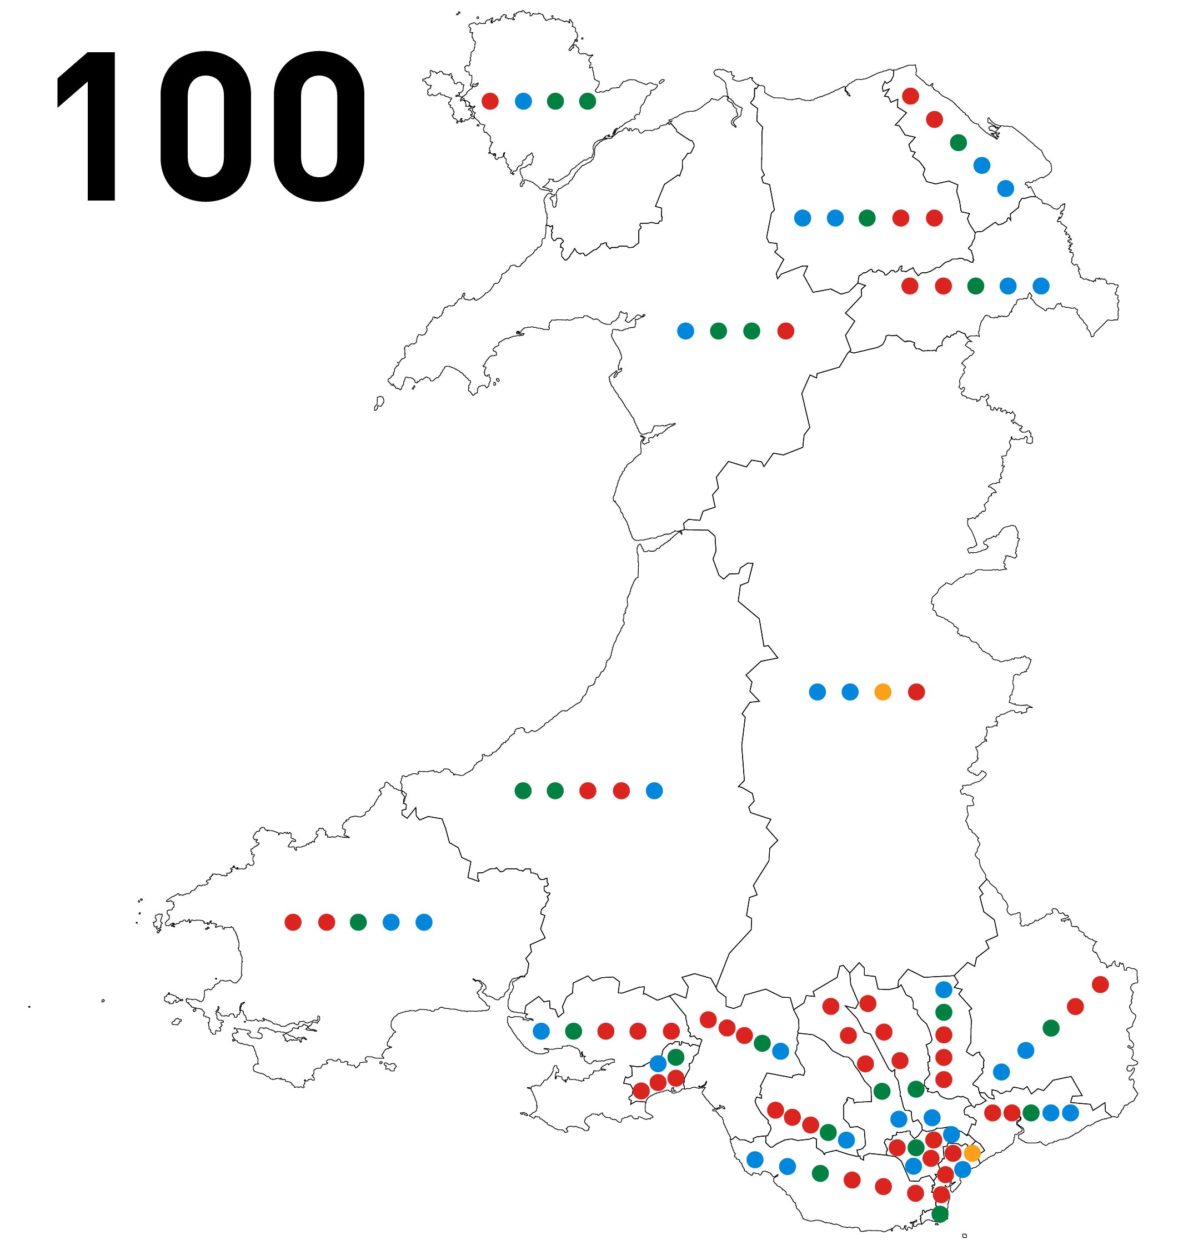
| Party | Con | Lab | LD | Plaid Cymru | Total Seats |
| Total seats under STV modelling | 29 | 47 | 2 | 22 | 100 |
| Percentage of seats under STV modelling | 29.00% | 47.00% | 2.00% | 22.00% | 100.00% |